Bar Graph


Bar Graph
Bar Graph:
A bar graph is a pictorial representation of the numerical data by a number of bars (rectangle) of uniform width erected horizontally or vertically with equal spacing between them. Each rectangle or bar represents only one value of the numerical data and so there are as many bars as the number of values in the numerical data. The height or length of a bar indicates on a suitable scale the corresponding value of the numerical data.
Properties Of Bar Graph:
Steps in construction of Bar Graphs / Column Graph:
Step 1: On a graph, draw two lines perpendicular to each other, intersecting at O (Origin). The horizontal line is x-axis and vertical line is y-axis.
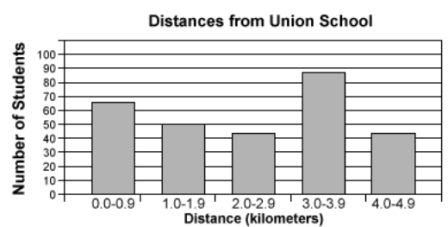
The graph includes distances for all the students at Union School. About how many students attend the school? | |||
| Right Option : D | |||
| View Explanation | |||
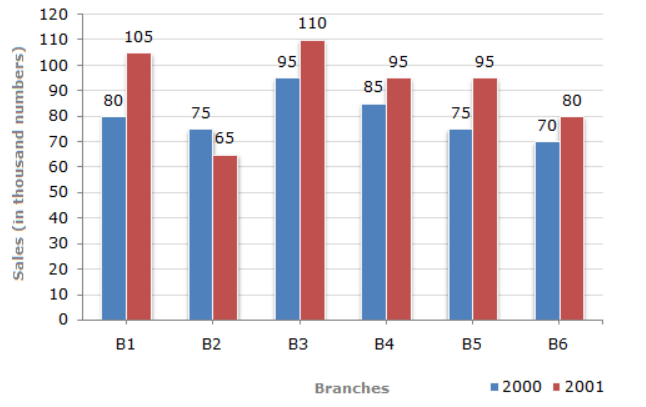
What is the average sales of all the branches (in thousand numbers) for the year 2000?
| |||
| Right Option : C | |||
| View Explanation | |||
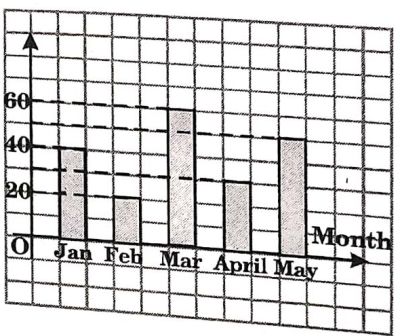
The bar chart shows the number of television sets sold by a shop in 5 months. The sales in May, as a percentage of the total sales in the 5 months is:
| |||
| Right Option : A | |||
| View Explanation | |||
Students / Parents Reviews [10]
Abhyas Methodology is very good. It is based on according to student and each child manages accordingly to its properly. Methodology has improved the abilities of students to shine them in future.

Manish Kumar
10thAbout Abhyas metholodology the teachers are very nice and hardworking toward students.The Centre Head Mrs Anu Sethi is also a brilliant teacher.Abhyas has taught me how to overcome problems and has always taken my doubts and suppoeted me.

Shreya Shrivastava
8thIt was a good experience with Abhyas Academy. I even faced problems in starting but slowly and steadily overcomed. Especially reasoning classes helped me a lot.

Cheshta
10thMy experience was very good with Abhyas academy. I am studying here from 6th class and I am satisfied by its results in my life. I improved a lot here ahead of school syllabus.

Ayan Ghosh
8thIt has a great methodology. Students here can get analysis to their test quickly.We can learn easily through PPTs and the testing methods are good. We know that where we have to practice

Barkha Arora
10thIt was good as the experience because as we had come here we had been improved in a such envirnment created here.Extra is taught which is beneficial for future.

Eshan Arora
8thA marvelous experience with Abhyas. I am glad to share that my ward has achieved more than enough at the Ambala ABHYAS centre. Years have passed on and more and more he has gained. May the centre flourish and develop day by day by the grace of God.

Archit Segal
7thAbhyas is a complete education Institute. Here extreme care is taken by teacher with the help of regular exam. Extra classes also conducted by the institute, if the student is weak.

Om Umang
10thMy experience with Abhyas is very good. I have learnt many things here like vedic maths and reasoning also. Teachers here first take our doubts and then there are assignments to verify our weak points.

Shivam Rana
7thBeing a parent, I saw my daughter improvement in her studies by seeing a good result in all day to day compititive exam TMO, NSO, IEO etc and as well as studies. I have got a fruitful result from my daughter.